In one of the earlier blogs of mine, I was testing different algorithms and their performance for the purpose of increasing/decreasing the volume factor for the sound samples using Multitime tool, which basically runs the program specified number of times and reports the mean time it took to run the program.
Today I will be testing the same algorithms on the same architectures as last time (Raspberry Pi 3 B+ (1.4GHz 64-bit quad-core processor), Aarm64 server (2.0GHz 64-bit octa-core processor) and x86_64 (2.4GHz 64-bit quad-core processor)) with the profiling tool gprof. Gprof produces two types of output: flat profile, which shows the total amount of time it took to each program function to execute, how many times it was called and other excluding functions which were not called by the program during the execution (to see those function add -z when compile, more about it in a while); and call graph, which shows how much time it took to execute the function and its children (other functions called during its execution). It works as follows:
- Compile program with -pg flag
- Run the program, the out file will be generated during this step
- Run the gprof programName The report will be seen in the console.
An extra step that can be taken is generating the graphical representation of the report in a variety of formats like .pdf, .svg, etc.
- For generating .svg report: gprof programName | gprof2dot | dot -Tsvg > reportName.svg
Here is how the report based on one of my algorithms looks like:
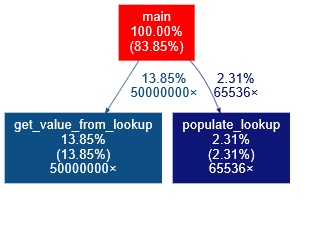
So we can see that my program contains main thread (main), in which it makes calls to two functions: get_value_from_lookup called 50000000 times and populate_lookup called 65536 times. The percentage values indicate the percent of time spent on each of the functions respectively.
I personally like to see the report with raw data instead of in graphical representation, thus I will be checking gprof report in raw format for my algorithms.
Firstly, I’m going to examine the data I received when ran gprof on my Raspberry for the 1st selected algorithm (floating-point multiplication of, in this case, an array of 5,000,000 samples). I have compiled the program in the following way: gcc -g -O0 -pg, since I’ll be testing different levels of optimization.
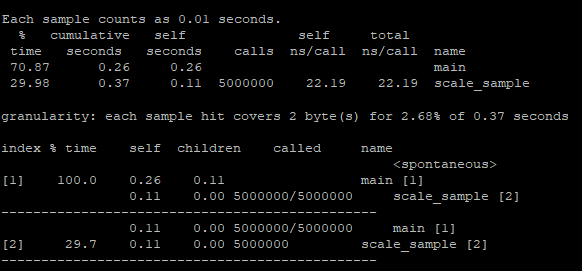
Note: I combined the flat profile with graph representation.
Based on the screenshot we can see that to execute our main function it took 70.87% of the entire execution, 0.26 seconds. The scale_sample function is the one which executes the multiplication of the provided sample and returns it took 29.98% of the execution time, 0.11 seconds, it was called 5,000,000 times (field “calls”). The graph call contains entries per function (separated by dashed lines). The data represented here is similar to the one in the flat profile.
Below, you will find the results of profiling all three algorithms with gprof (compiled with optimization off – -O0 flag) on all three machines.
Raspberry Pi:
| Algorithm | Full Program | Logic |
| Floating-point multiplication | 0.37 | 0.11 |
| Lookup | 0.44 | 0.09 |
| Fixed-point multiplication | 0.38 | 0.12 |
X86_86 server:
| Algorithm | Full Program | Logic |
| Floating-point multiplication | 1.2 | 0.11 |
| Lookup | 1.15 | 0.24 |
| Fixed-point multiplication | 1.12 | 0.06 |
Aarm64 server:
| Algorithm | Full Program | Logic |
| Floating-point multiplication | 0.96 | 0.05 |
| Lookup | 0.98 | 0.08 |
| Fixed-point multiplication | 0.92 | 0.1 |
There are some strange things I noticed in the output of gprof, when comparing with the results I got profiling with multitime. As I mentioned, I have compiled my programs with optimization off to profile with gprof, and the results of the time taken to run the programs on Raspberry Pi with gprof optimization off are very close to the results I got compiling the program with optimization on and profiling it with multitime. This doesn’t seem to be right. At the same time, the profiling results of these runs on Aarm64 is drastically different compiling with -O0 and -O3. Thus I decided to try to re-compile my programs in the following way: gcc -pg -g -O3 to see what the compile-time optimization will give me with gprof.
Unfortunately, the results were not generated with -O3 giving me an empty profiling report. After researching a little while on this problem, I figured there is a known bug, which might, in some cases, be solved by compiling the program with the flag -fno-pie (turning off PIE during compiling), however, it didn’t work for me. Also, apparently, when compiling the program with gprof with -O3, the results might be strange due to the fact that compile-time optimization enables inline functioning (more about it here). So, I was unable to get the results of optimized by compiler code with gprof, which is why I started looking for another profiling tool and found perf and it proved to be amazing!
Perf. How to!
To profile with perf, we don’t need to include any flags to the gcc while compiling. Instead, we just compile it the way we need, let’s start with gcc -g -O3. Firstly, I would like to capture the time it takes for the program to run. We can check it by running perf stat -d programName. Stat stands for “Run a command and gather performance counter statistics”, -d means “detailed”, which gives us information on cache usage. Below are the results I got running the first algorithm on my Raspberry Pi:
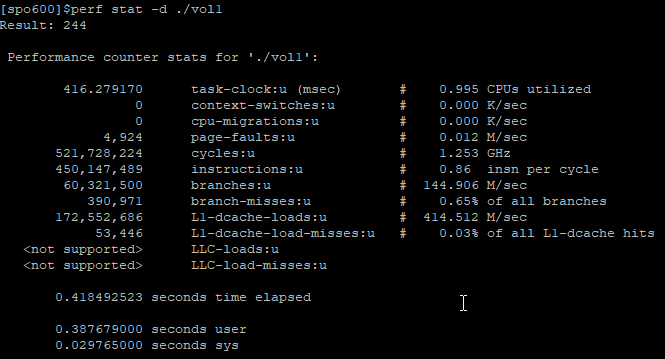
We’re getting here some data on CPU utilization (0.995%), we also get information on the number of cycles to run the program, cache access, etc. At the end of the report, we get the information on the time it took to run the program, we are interested in user time, as it provides information on how long it took to run our program specifically.
To see how long it took the program to perform each task/function of the program, we run:
Perf recort -g programName
This command will generate the file called perf.data. To see the report, we run:
Perf report
This is the output:
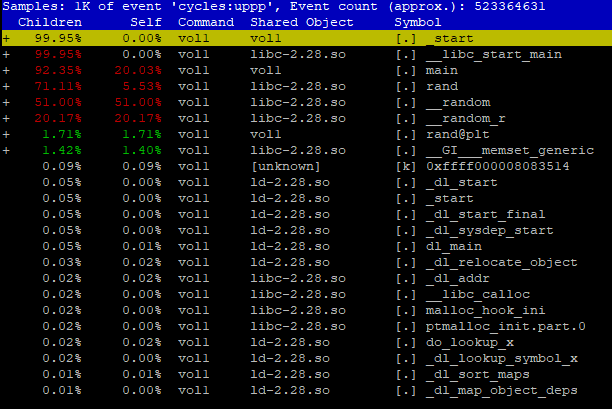
Here we can see how long (in percent) it took to run each task. To generate 50,000,000 random numbers for our array of samples it took more than 70% of all time. Notice that there is no scale_sample function here, which is performing the calculations. As I mentioned earlier, when we compile the code with -O3, the compiler uses incline functioning to optimize the code. If we disassemble the executable, we’ll see that there is no scale_sample there at all. On the other hand, when we compile the program with -O0, the function is being preserved and the disassembly looks extremely long and complicated.
Below are the results per each architecture compiled with -O0 and -O3, the field for logic is defined only for O0, because of the reasons mentioned above. Since perf gives information about % of time spent on the function, I have specified the values in seconds with ‘~’ – approximately.
Raspberry Pi:
| Algorithm | Full Program | Logic |
| Floating-point multiplication | O3: 0.372; O0: 0.629; | O0: ~0.06 (10.94%) |
| Lookup | O3: 0.455; O0: 0.734; | O0: ~0.107 (14.60%) |
| Fixed-point multiplication | O3: 0.369; O0: 0.631; | O0: 0.05 (8.07%) |
X86_64 server:
| Algorithm | Full Program | Logic |
| Floating-point multiplication | O3: 1.147; O0: 1.716; | O0: ~0.222 (12.96%) |
| Lookup | O3: 1.194; O0: 1.754; | O0: ~0.281 (16.04%) |
| Fixed-point multiplication | O3: 1.133; O0: 1.713; | O0: ~0.189 (11.06%) |
Aarm64 Server:
| Algorithm | Full Program | Logic |
| Floating-point multiplication | O3: 2.469; O0: 3.239; | O0: ~0.176 (5.46%) |
| Lookup | O3: 2.544; O0: 3.257; | O0: ~0.399 (12.28%) |
| Fixed-point multiplication | O3: 2.392; O0: 3.027; | O0: ~0.178 (5.89%) |
For all the architectures, we see that the fixed-point multiplication is faster than the other algorithms. In all of the cases above the second algorithm, which creates a look of more than 65,000 values in order to avoid the multiplication part per each sample and, instead, searching for the value in the generated lookup table, is slower, sometimes significantly. Thus, I decided to check the cache usage to check the memory footprint, these are my findings:
Note: LLC stands for last level cache.
Raspberry Pi:
| Algorithm | -O0 | -O3 |
| Floating-point multiplication | L1 dcache loads: 426.128 M/sec (0.03% of all L1-dcache); LLC not supported. | L1 dcache loads: 416.297 M/sec (0.03% of all L1-dcache); LLC not supported. |
| Lookup | L1 dcache loads: 397.785 M/sec (1.40% of all L1-dcache); LLC not supported. | L1 dcache loads: 367.811 M/sec (2.30% of all L1-dcache); LLC not supported. |
| Fixed-point multiplication | L1 dcache loads: 442.102 M/sec (0.03% of all L1-dcache); LLC not supported. | L1 dcache loads: 422.231 M/sec (0.03% of all L1-dcache); LLC not supported. |
X86_64 server:
| Algorithm | -O0 | -O3 |
| Floating-point multiplication | L1 dcache loads: 1407.391 M/sec (0.02% of all L1-dcache); LLC loads: 1.867 M/sec (1.52% of all LLC loads). | L1 dcache loads: 868.837 M/sec (0.16% of all L1-dcache); LLC loads: 2.605 M/sec (1.55% of all LLC loads). |
| Lookup | L1 dcache loads: 1363.212 M/sec (1.58% of all L1-dcache); LLC loads: 22.962 M/sec (0.57% of all LLC loads). | L1 dcache loads: 867.715 M/sec (4.01% of all L1-dcache); LLC loads: 31.995 M/sec (0.46% of all LLC loads). |
| Fixed-point multiplication | L1 dcache loads: 1394.211 M/sec (0.02% of all L1-dcache); LLC loads: 1.800 M/sec (1.57% of all LLC loads). | L1 dcache loads: 849.762 M/sec (0.02% of all L1-dcache); LLC loads: 2.606 M/sec (1.58% of all LLC loads). |
Aarm64 server:
| Algorithm | -O0 | -O3 |
| Floating-point multiplication | L1 dcache loads: 861.424 M/sec (0.21% of all L1-dcache); LLC not supported. | L1 dcache loads: 649.750 M/sec (0.28% of all L1-dcache); LLC not supported. |
| Lookup | L1 dcache loads: 898.149 M/sec (1.48% of all L1-dcache); LLC not supported. | L1 dcache loads: 674.543 M/sec (2.40% of all L1-dcache); LLC not supported. |
| Fixed-point multiplication | L1 dcache loads: 919.317 M/sec (0.20% of all L1-dcache); LLC not supported. | L1 dcache loads: 674.329 M/sec (0.27% of all L1-dcache); LLC not supported. |
Notice that in case of all the architectures the performance optimization increases the cache usage. And also, obviously, more cache is used while executing the lookup.
References:
https://ftp.gnu.org/old-gnu/Manuals/gprof-2.9.1/html_chapter/gprof_5.html
https://sourceware.org/binutils/docs/gprof/Call-Graph.html
https://sourceware.org/binutils/docs/gprof/Introduction.html
https://forum.manjaro.org/t/issue-with-gprof/28584
